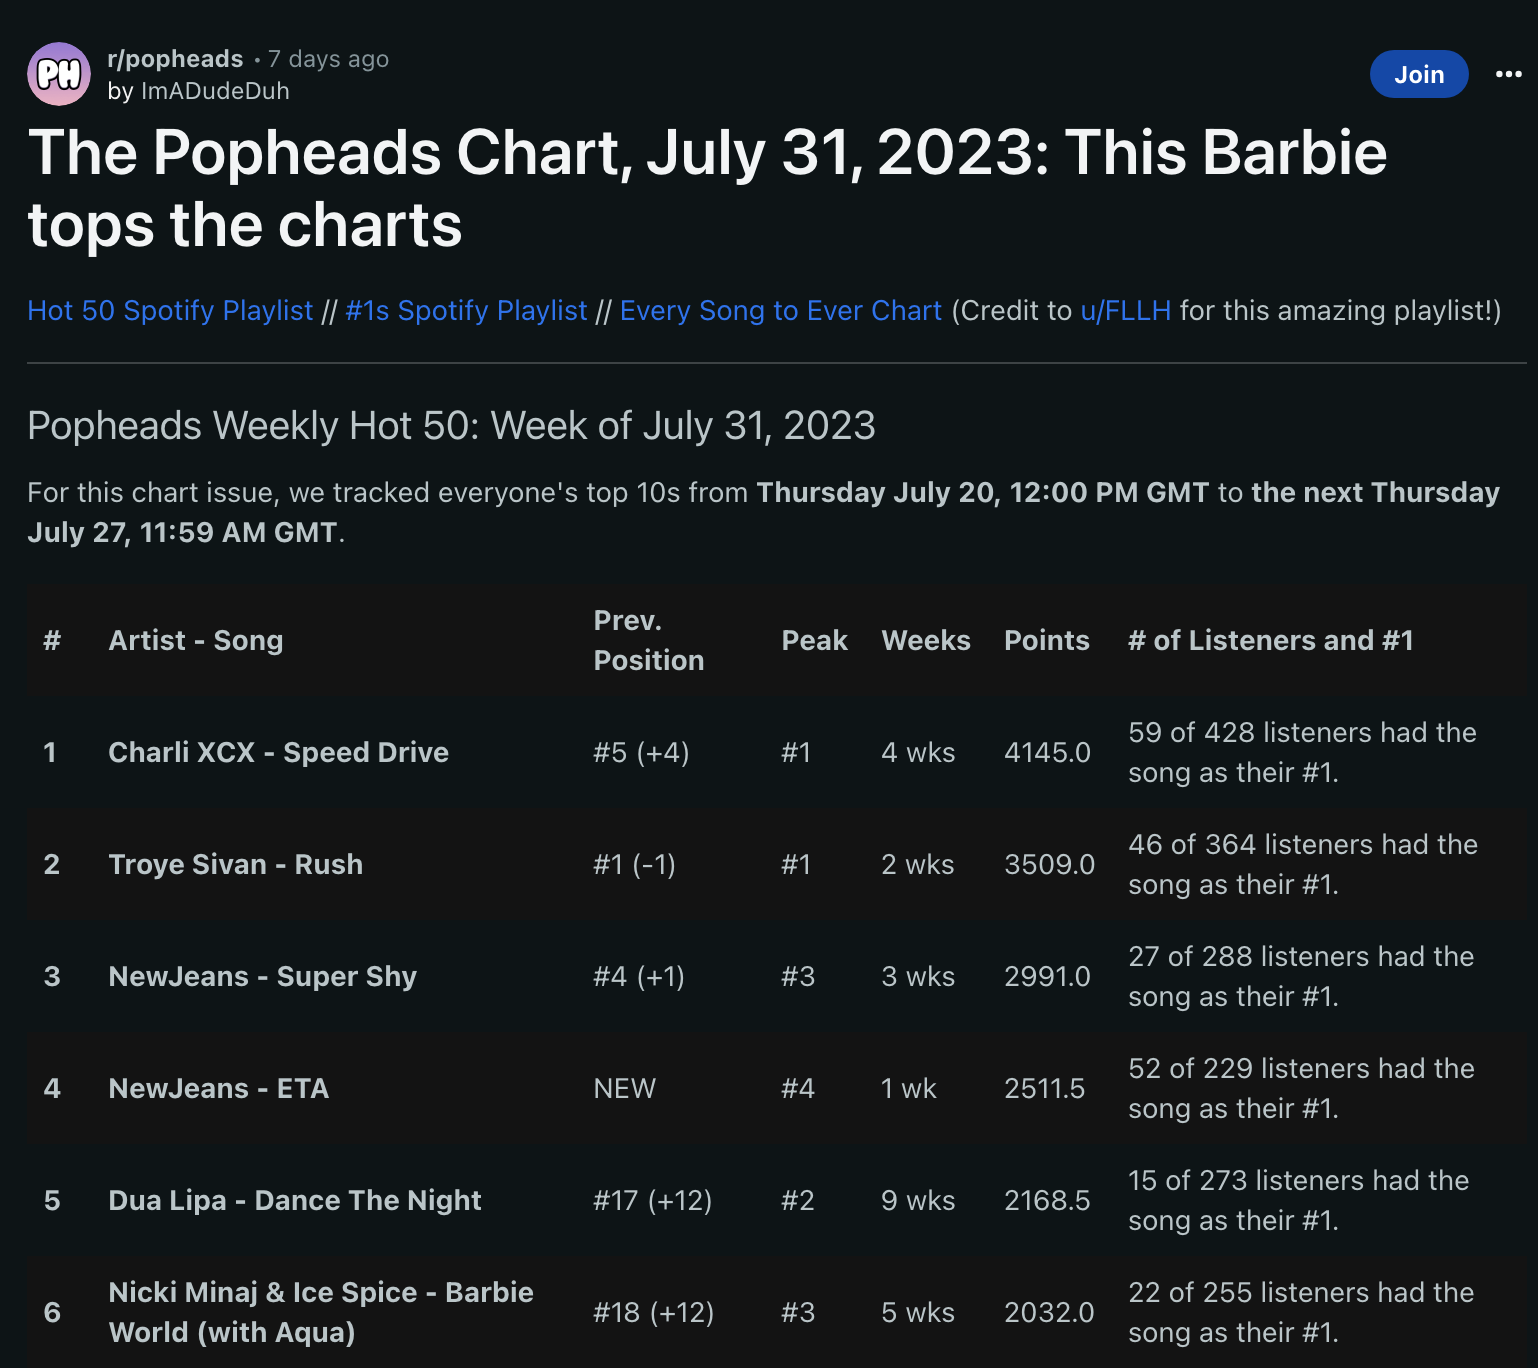
In 2020, I was involved in an online pop music community called Popheads. A great feature of Popheads was the weekly charts, which aggregated the listening stats of community members to generate a table of the top songs of the week (shown below). However, these charts were a pain to access, especially ones from previous weeks. I decided to make an app that would allow users to see all Popheads charts from a single page.
Unlike the smooth progress of the Quizbowl Website, progress on the Popheads Chart came in fits and starts. I was out of my depth when I started working on it, and I had no concept of the technical knowledge that the project would require. There were times when I stopped working on it, and during some of those times I thought I would leave the Popheads Chart unfinished forever. Knowing what I know now, there are a thousand things I would have done differently. But it came together in the end, and I feel proud of how it came out.
Table of Contents
- Java Edition (Summer 2020)
- Shiny Edition (Spring 2021)
- React Edition (Winter 2022)
- The Final Push (Spring 2023)
- Conclusion
Java Edition (Summer 2020)
For a long time, the only programming language I knew really well was Java. I had touched various programming languages in elementary and middle school, but Java was the only fully-featured language I had used in a formal setting. Because of this, I first tried to interact with the Internet in Java.
At first, the Popheads Chart was purely for me. I wanted to have a landing page of sorts for my own personal use, which would load in information from the web pages I most wanted to visit. I was unfamiliar with APIs at the time, so my first reaction was to use web scraping to get information. Early images of the Popheads Chart have been lost to time, but essentially I was loading data directly into the command line of my IDE.
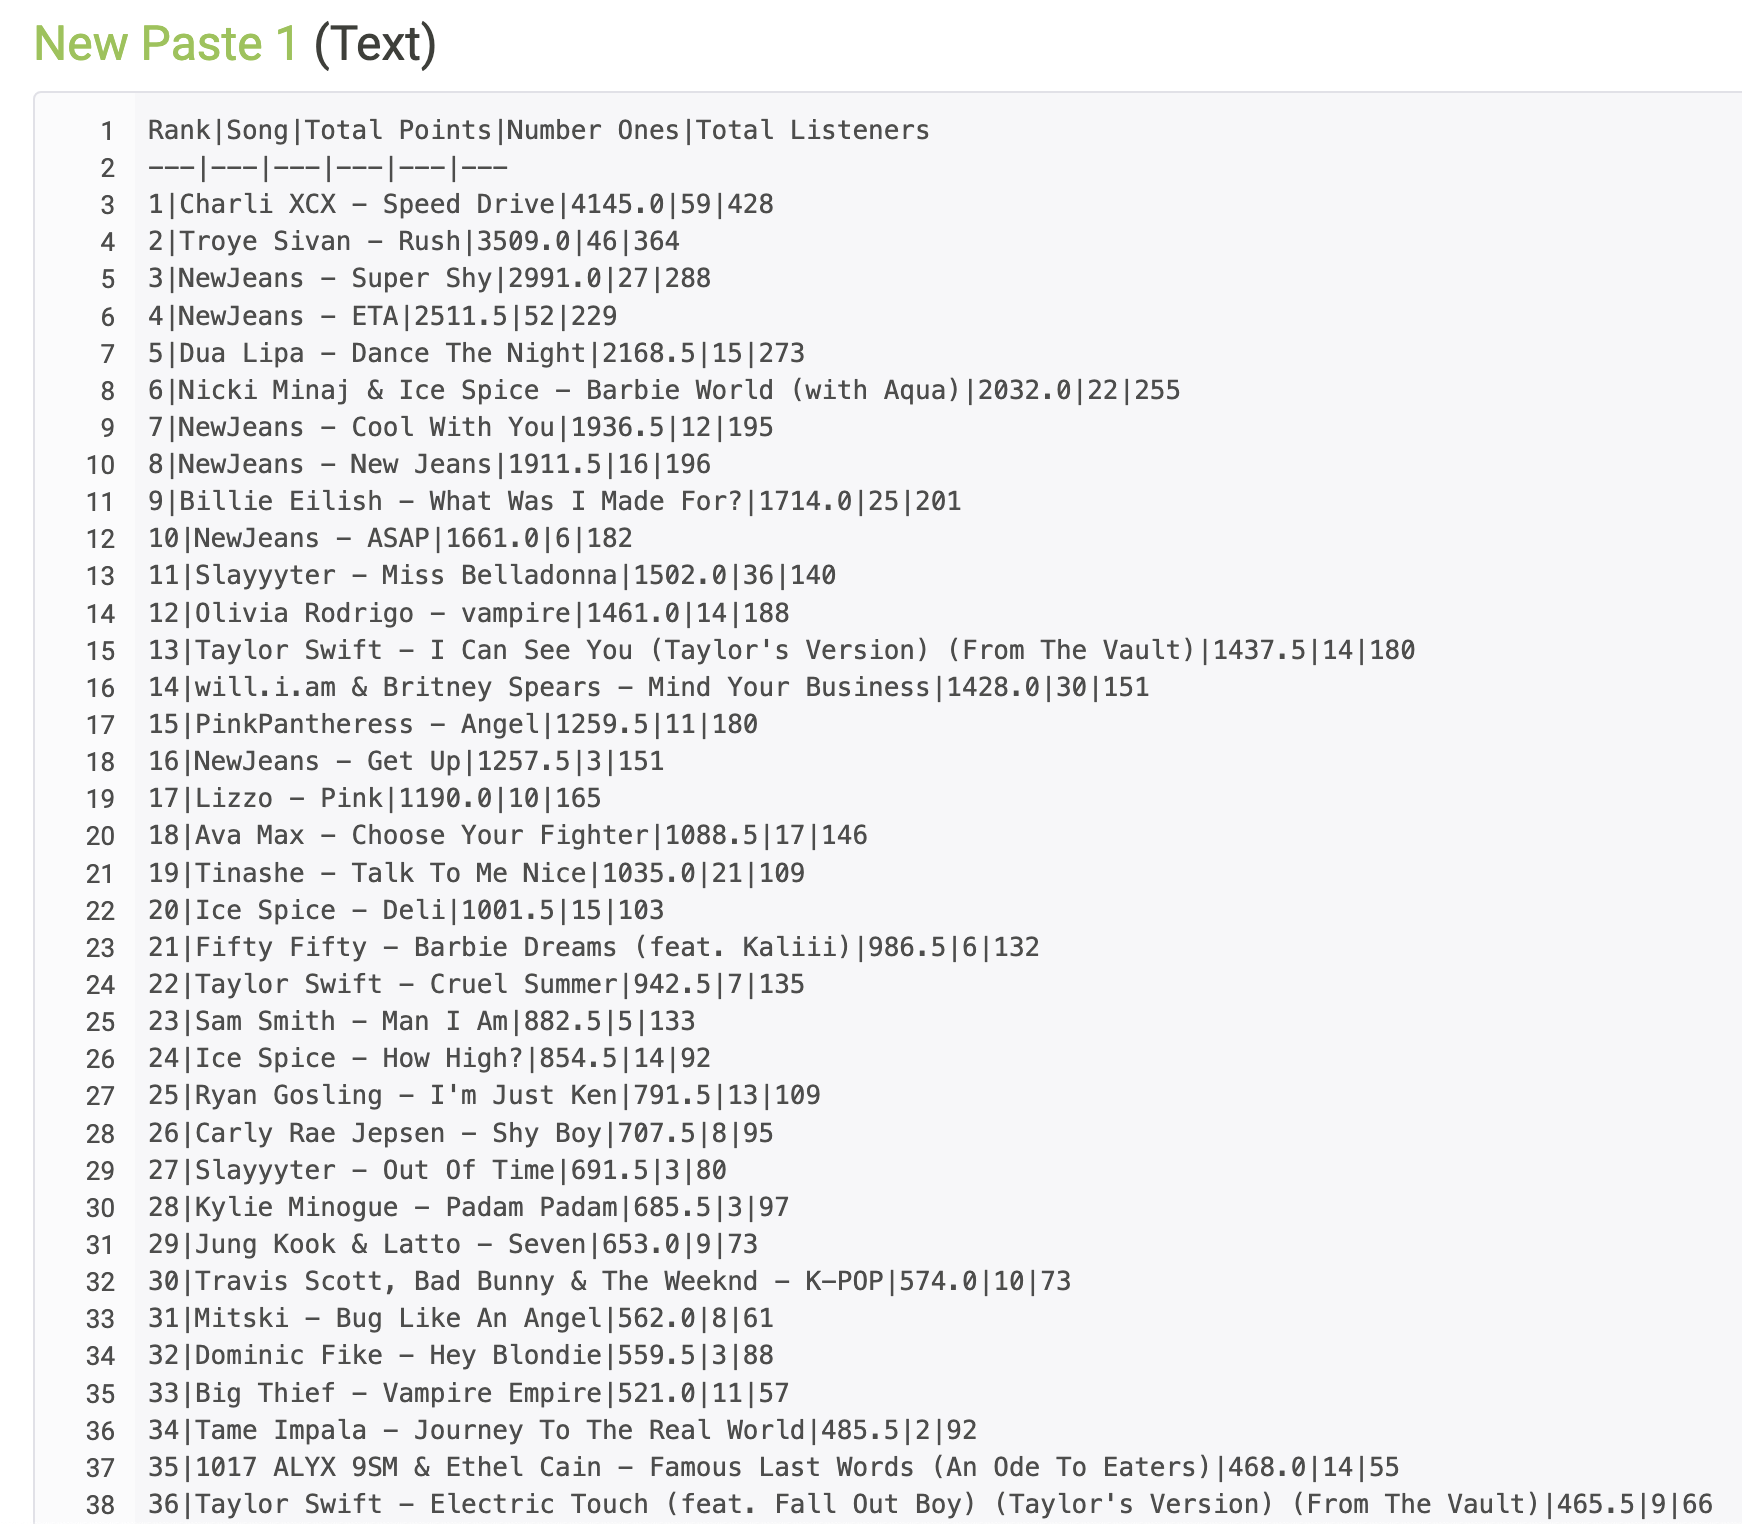
My web scraping approach was primitive at best. Because there was no centralized repository for the charts to my knowledge, I was forced to click through the author's post history in order to scrape the chart data. This was an arduous process that had me exploring technologies like Puppeteer and Selenium. I eventually arrived at the solution of using the old Reddit site UI, which has been kept around primarily for developers.
Even with the old UI, there were still some really annoying problems associated with scraping the data. The chart files were stored in a hyperlink inside of a comment. There was no special identifier for this comment, so I just had to scan for the text and username. Sometimes the comment wasn't even a top-level comment, so if I didn't find it then I had to unroll the comment thread. Also, because the information was manually entered, a lot of it broke my parser. I ran into several date parsing issues caused by typos in particular. The code had to go through many hacky exception handling steps before it could actually run properly.
Once I had everything up and running, I wanted to know if there was some way I could put the code on the Internet. I didn't know anything about web development, so I figured there was some easy way to simply mount Java code on the Internet. But after reading about technologies like Spring and Tomcat, I quickly became confused. I came to realize that web development was a different beast, and I was going to need to gain a lot more knowledge than just Java . I soon learned that this was going to take longer than I originally thought, so I put the project on the backburner for a few months.
Shiny Edition (Spring 2021)
After I made the Wandering Inn Visualization, I realized that I finally had the power of web development at my fingertips in the form of Shiny. Without too much effort, I could probably port the code over from Shiny and put something on the Internet. (Unfortunately, images of this version of the app are also lost to time.)
This proved to not be quite so simple. R is a very different language from Java, so I needed to update a lot of code to get it up and running. There had also been some minor changes to the chart formats, which forced me to update a lot of my parsing logic. These changes further demonstrated the unreliability of my web scraping approach.
The biggest problem that I had with Shiny is that it was super slow. It was slow at page load (Shiny apps take a long time to spin up), and it was also slow at the web scraping step. The lack of a true server side meant that I couldn't use a proper database, which meant that I still had to scrape all the data on the client side. All of this meant that the app had a user experience that worked, but it was very inconvenient.
The final nail in the coffin for the Shiny version of the app was the lack of customizability. While I had a lot of freedom regarding the charts that were displayed on the dashboard, there was very little I could do to update the UI or the feel of the page. I really wanted more granular control, and I ultimately didn't feel like this was something that I could upload to the Internet. So I decided to put the project on the backburner yet again until I learned more about web technology.
React Edition (Winter 2022)
After taking a web dev class and spinning up a few React apps of my own, I finally had the tools I needed to make the Popheads Chart of my dreams. But if I wanted to do things right, I needed to rip everything up and start over.
My first task was setting up a proper web server. I decided to use create-react-app for my project, which is a starter kit that has all sorts of stuff for fullstack web development right out of the box. This made adding a Node.js server relatively straightforward. I also used Express.js to simplify the server-side code, with the intention of making a modern MERN stack application.
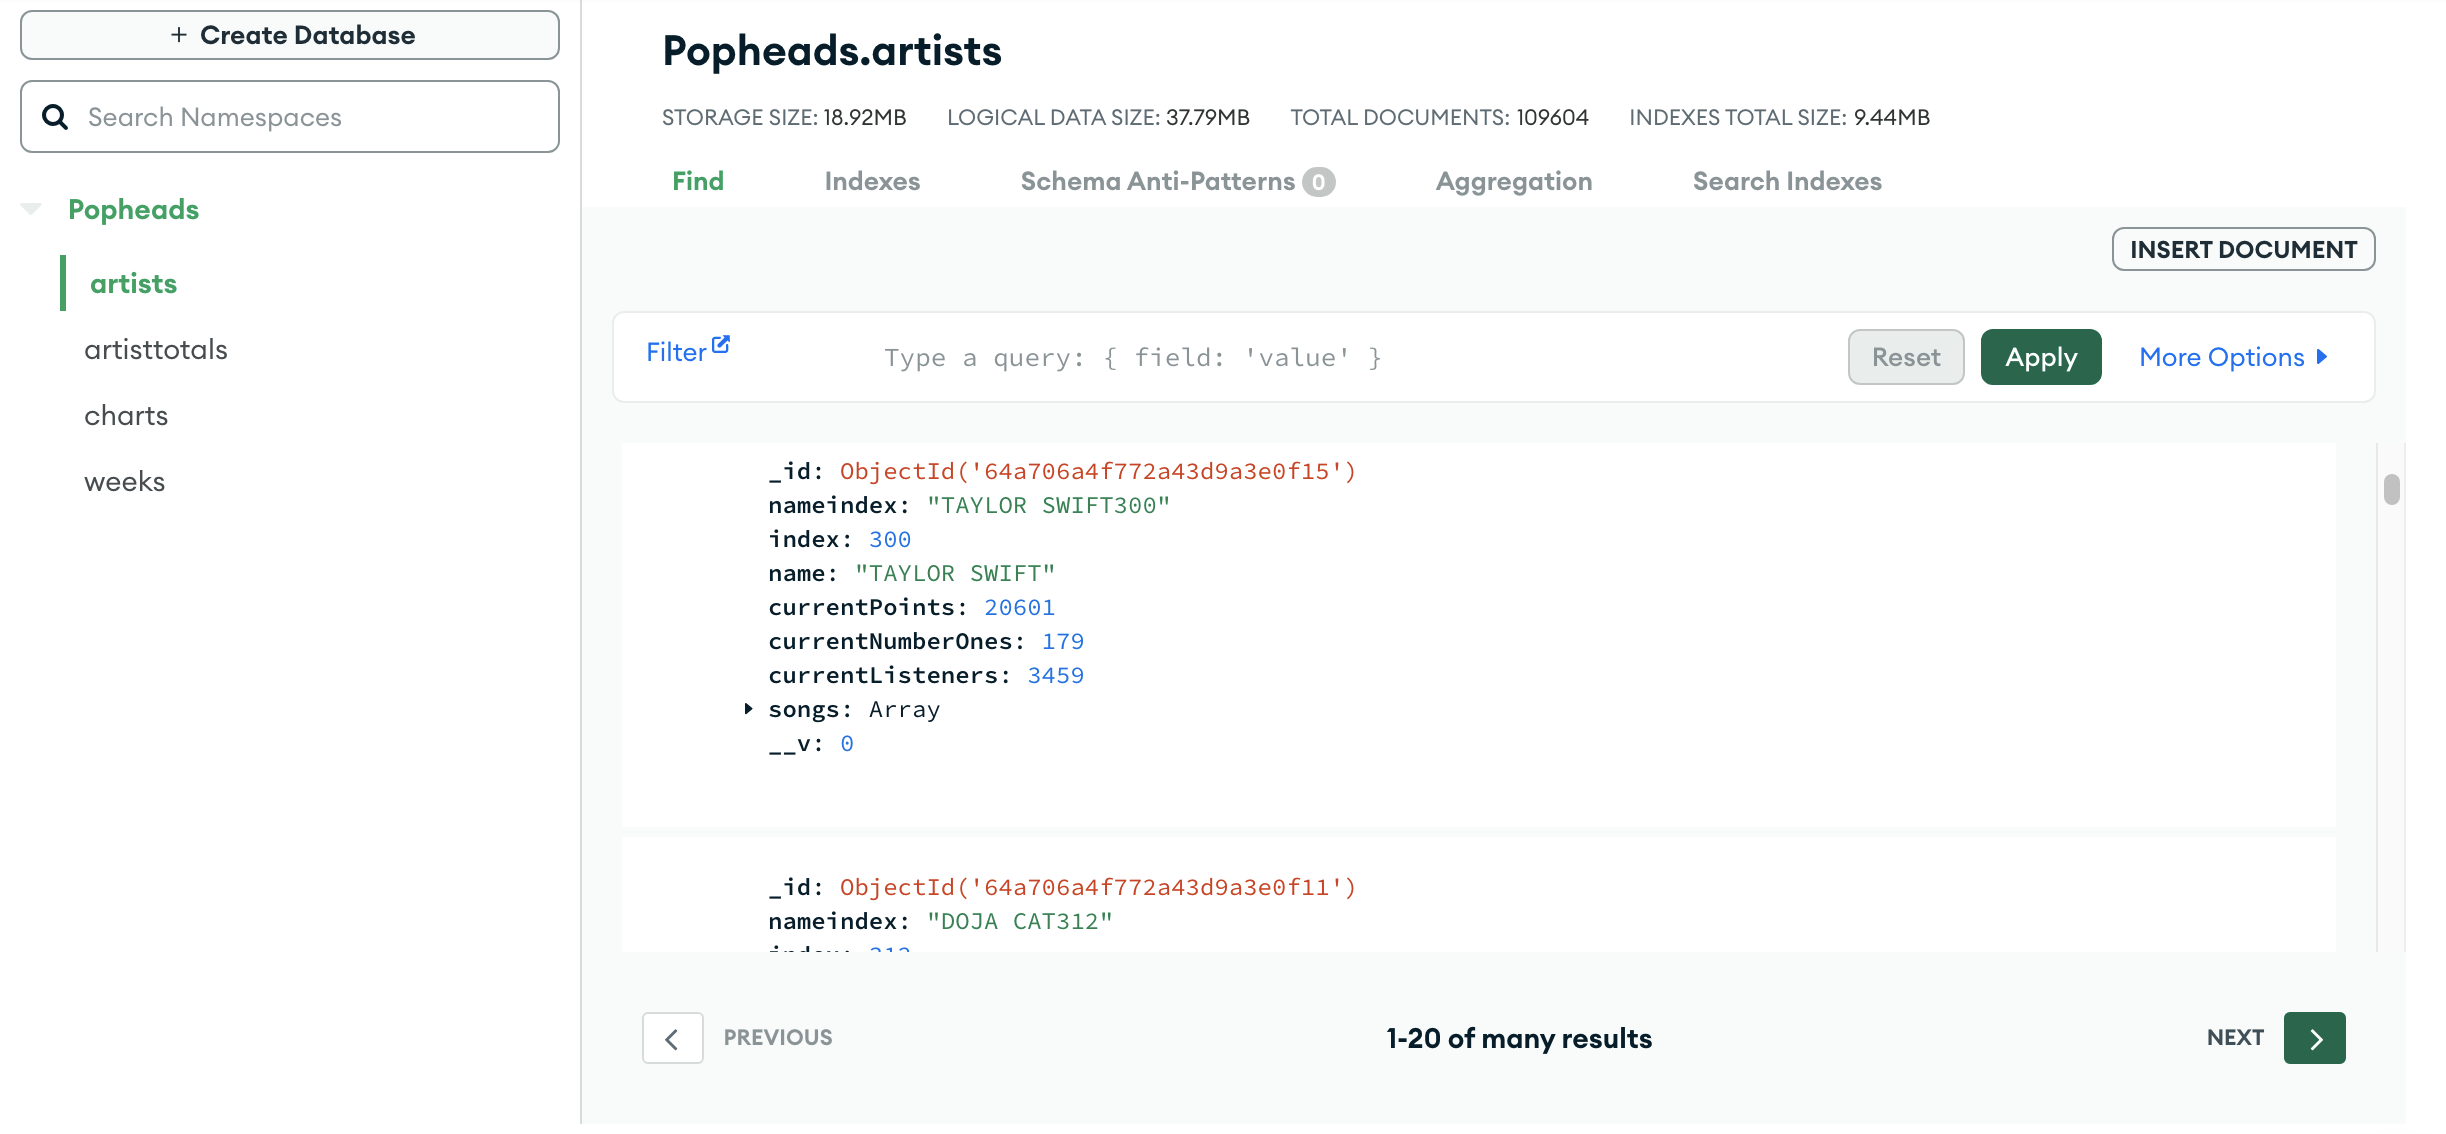
Now that I had server-side code, I could implement a proper database. MongoDB ended up being kind of a pain to work with, as I was only familiar with SQL databases up to that point. But the web client MongoDB Atlas was very user-friendly (shown below), as was the JavaScript wrapper library Mongoose. Using these tools, I was eventually able to get up to speed.
The next step was ditching my web scraping approach. Web scraping wasn't just slow, it was unreliable, unstable, and just generally a bad practice for this sort of task. I looked into the Reddit API, and I came up with a cleaner solution that employed the snoowrap library. Working with the API made me realize that there was missing data and that I could probably use some help finding chart locations. So I reached out to the user in charge of the charts. He told me that there was actually a chart repository buried somewhere, so I didn't need to keep digging through his post history. This simplified the code a lot, so I could focus more on the business logic. He was also able to send over the missing chart files.
During this process, I ended up creating a bunch of middleware API endpoints to facilitate data transfer. Some of my endpoints were used to load data directly into the database, while others were used for the client to interact with the server.
Once all that was taken care of, I started designing my frontend. In the spirit of React, I decided to make my app a single-page application. I used the react-select library to make the dropdown menus, and I used those menus to toggle all the many page views on the site. I decided to use the modern CSS framework Tailwind, which uses inline styling to simplify code. Since I had very few repeated styles, this was a perfect choice. I designed a simple pastel pink color scheme to match the theme of the subreddit, as well as some fancy bubble-shaped buttons.
One unique problem was the asynchronous code. Because of the reactive design, it was easy for users to confuse the React hooks by rapidly changing between views. I added an AbortController to handle this behavior, which kills simultaneous fetch requests if too many are made at once. I also added an update button, which made it so that I wouldn't have to go in and update the database for every release. With this new feature, clients could hit a button to trigger a script that ran if it found that the database was not up to date.
After finishing the Popheads Chart, I deployed it on Heroku. I also posted it on the community Discord to positive reception. The chart worked for a while, but Heroku actually ended their free tier offering while the app was deployed. There were some additional kinks that needed to be worked out relating to changes in the charts, so the project again lay dormant for a while as I became busy with other things.
The Final Push (Spring 2023)
I spent a long time trying to find a new home for my app, and I eventually found one: Render. Render was a relatively small hosting platform that made it easy to port apps over from Heroku. The process had many hiccups (to put it lightly), the most prominent one involving a missing .gitignore file. I was able to deploy it on Render after about a week of effort. However, the code was now out of date, and I wasn't able to fix some of the most critical problems. This left the project dormant yet again.
After more months of inactivity, a new tool arrived that gave me the inspiration to finish the project: ChatGPT. I had never pair-programmed with a computer assistant before, but ChatGPT had greatly impressed me with its capabilities. For one thing, ChatGPT was able to fix a small bug with my react-select menu, which highlighted the wrong default option. I was really impressed that it could handle such a niche bug, so I wanted to see if it could do more.
After inspecting several of my React components, ChatGPT finally was able to find the bug that was breaking my application. This allowed me to return to the task of updating the code for the new charts. The most significant change I had to make concerned a new chart location. The charts had switched file hosts from pastebin to past.ee, and I needed to update the code to handle both types of sources. But now that I had ChatGPT, coding was a breeze. It was able to successfully identify bugs as they came up, do menial tasks, and fix some of my messy asynchronous code. After about another week of work, I was able to finally deploy the completed application on Render.
I submitted the Popheads Chart on Reddit in January, where I got even more recognition than I had received the first time. It felt good to be appreciated for a community that I had been in for so long, and the feedback I got helped me feel satisfied with a long-delayed job well-done. I updated the site intermittently until the summer, at which point I considered the project finished.
Conclusion
As you can see from the top of this page, the chart is still up and running today (at least of this writing). There were a couple hiccups along the way that I had to fix, and my final fluorish was the addition of artist graphs. I am not sure how many active users are on the site, but the fact that it is always updated when I open the site indicates that people are still using it.
As you can see from the top of this page, the chart is still up and running today (at least of this writing). There were a couple hiccups along the way that I had to fix, and my final fluorish was the addition of artist graphs. ChatGPT was invaluable in this process, and I consider it a valuable tool in my coding arsenal.
Like I said at the begining, there are a thousand things I would have done differently if I were to start this project over again. I would have been able to do everything much more quickly and efficiently with the knowledge that I have today, and I wouldn't have had to spend so many hours slaving away at this web scraping Java code that never should have been used for the task. But on the other hand, that's kind of just what learning how to code is about. That is, struggling through frustrating tasks so you have an appreciation for the proper way to do things when come out the other side. Without the Popheads Chart, I might never have discovered a love for programming. I am thankful for everything it was able to teach me, as well as the Popheads community itself for being such an inspiration.
—K, August 2023